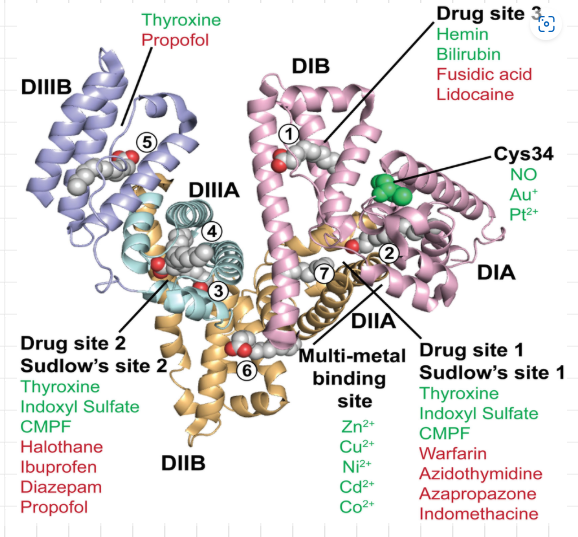
It is amazing what you’ll find by just looking around. While reviewing recent blood test results it occurred to me that I didn’t know the first thing about albumin as a protein. A Google word search led to numerous links but provided many images as well. The crystal structure is below.
Source. The crystal structure of human albumin. The albumin was crystallized in the presence of excess palmitic acid for x-ray analysis. Front. Immunol., 25 January 2015, Sec. Vaccines and Molecular Therapeutics Volume 5 – 2014 | https://doi.org/10.3389/fimmu.2014.00682
It is not uncommon to describe the enzyme-substrate complex as a highly specific lock and key structure. In the earlier literature is was axiomatic that enzymes are described as being highly substrate specific and use a single binding site for a given substrate. This notion is not always correct as the above graphic shows. Albumin is produced in the liver and is sort of a molecular ox cart- it can transport many substrates in the blood.
The job of human albumin is to get various substrates mobilized in the bloodstream and offer them at a desirable location. With the high molecular weight of enzymes, and the consequent low molarity available, it is astonishing that the heat of binding of substrate to enzyme can be measured at all.
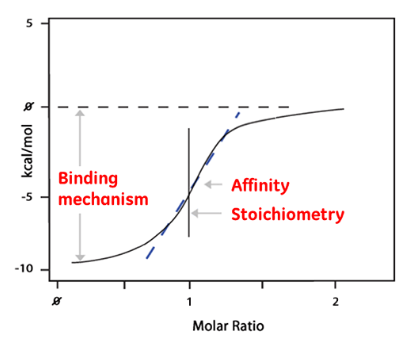
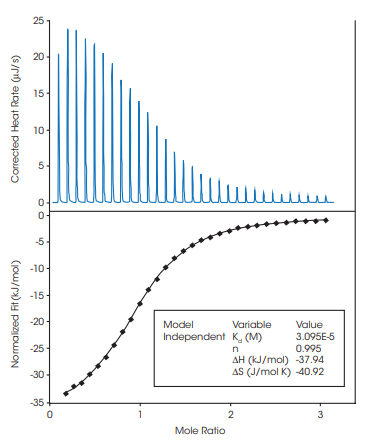
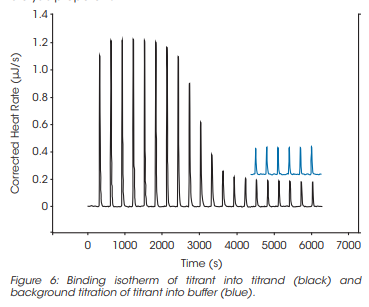
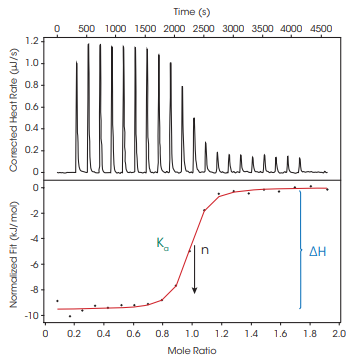
One way to determine binding enthalpy and stoichiometry of a substrate to enzyme is ITC- Isothermal Titration Calorimetry. These calorimeters are available from several manufacturers such as TA Instruments and Malvern. ITC is just a type of reaction calorimeter that allows for immediate access to the reaction mixture. It is a microscale RC1 in effect. An enzyme solution can be titrated with substrate allowing for a visual determination of an equivalence point where 1 eq of enzyme active sights just matches the titrant equivalents. From such an experiment both enthalpy and stoichiometry can be measured. The image below is from TA Instruments and nicely shows the graphic output of an ITC experiment.
Source: TA Instruments product brochure. Each peak is an aliquot of titrant. Note how cleanly the signal goes to baseline between aliquots.
This graphic shows the baseline signals from titrating directly into buffer. This is subtracted from an actual run. From TA Instruments sales brochure.
Above, the background signal from the buffer represents noise in the enthalpy signal.
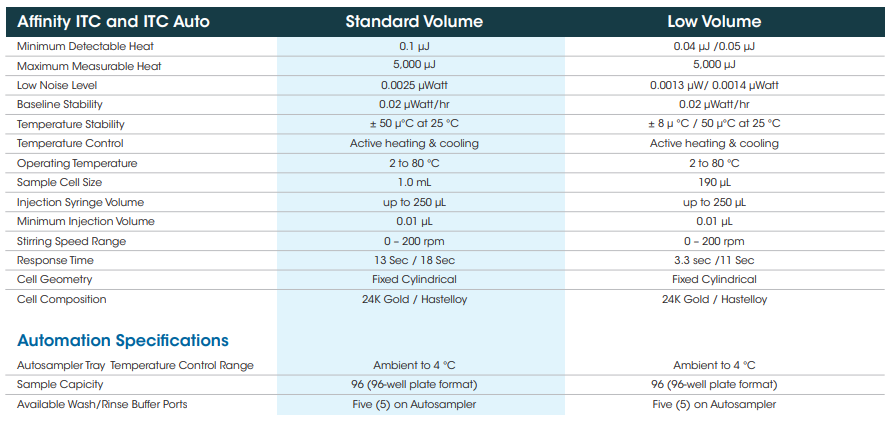
TA Instruments also offer equipment for so-called nano scale experiments. See below.
The TA ITC specification table. Note the minimum heat in the low volume column: 0.04 to 0.05 microJoules with a 190-microliter sample cell size.
Albumin is endowed with binding sites open to a variety of substrates. It is like a wheelbarrow or an ox cart. It can ‘carry’ numerous substrates across several categories.
The downside of such low specificity is that albumin can bind many drug compounds at the expense of dose delivery to the desired site. Doses of drugs must be adjusted to account for drug lost to blood proteins like albumin.
Abstract: I’m going to make a pitch for incinerating plastic. Yes, it will indeed produce CO2. But as we go merrily down the reduced carbon footprint path, I think it is reasonable to exempt certain activities from stringent reduction. One of them is incineration of waste. It can be done efficiently while generating electrical power and can be put to use in getting rid of BTU-laden waste combustibles like plastic.
Synthetic polymers, i.e. plastics, long ago rose to a high level of production due to demand. In particular, plastics like polyethylene (PE), polypropylene (PP), polystyrene (PS), polyethylene terephthalate (PET), polyvinyl chloride (PVC), polyvinyl acetate (PVA), polyurethanes, polymethylmethacrylate (PMMA), various polyamides and adhesives are produced at incomprehensible scale. Within several of these major polymer varieties are their copolymers. LDPE is a good example. Low density polyethylene is a copolymer of ethylene and alpha-olefins like 1-butene, 1-hexene, and 1-octene. Placing the olefin group (C=C) exclusively at the 1-position requires some large-scale wizardry as internal olefins are thermodynamically more stable. Generally, commodity scale alpha-olefins have the terminal olefin put in place as they are made, not afterwards. These comonomers interfere with crystal formation within the bulk polymer. This has a large effect on many things including melt temperature, melt strength, stiffness, glass transition temperature, puncture resistance, tensile strength and lower density.
||| Side Note: Alpha olefins have other uses besides polymer manufacture. They are a crucial raw material for plasticisers, soaps/detergents, lubricants and oilfield chemicals. Interestingly, ethylene is a ripening hormone used by fruit.
The low unit price of plastic products like films, food packaging and medical packaging along with steady marketing has conditioned the consumer to expect such goods as disposable. And the plastics industry is happy to fill that expectation. Single use applications fill homes, businesses, hospitals … everywhere. Single use plastic waste also fills landfills, the countryside, waterways, and increasingly the oceans.
Recycling of plastic waste is complicated. Plastics may be made of just the pure homopolymer with only a single repeat monomer or along with a copolymer. A blend of mixed polymer waste may also contain a dog’s lunch of pigments, soot, intumescent additives, plasticizers, glue residues or labels, multiple layers of different polymers and UV blockers- components that you are unlikely to want to transfer into the final product. Even if you neglect the additive problem, there is always the immiscibility of different polymers. Yes, mixed polymers do not always form a homogeneous melt. This is a problem for everyone down the value chain.
Making polymers
While the end-use consumer is the final customer of the producer’s polymer, it is the converters who order the resin pellets directly from the polymer producers or wholesalers. Those who design the plastic article may or may not do a deep dive into the exact brand and grade of plastic to be used. Certainly there many articles (toys) that can be made from a variety of plastic brands and specifications where buyer input may be unknowledgeable or minimal. For many buyers of finished plastic goods, like everything price is likely to be the major parameter.
Users of performance polymers for demanding applications requiring particular polymer specifications will be more specific in their requirements.
The converters blow continuous films or do the injection or blow molding for those who set the final product specs. The converters buy their raw polymer on the basis of specified properties. One measure of the suitability of a particular polymer grade relates to the torque required to produce the maximum number of widgets per hour from the extruder. The converter’s business economics depend on throughput. A polymer that is otherwise wondrous to behold but its melt is too viscous will be problematic for the converter if it requires considerable torque from the extrusion equipment.
Make no mistake, retailers like Home Depot or Menard’s neither know or care about polymer specifications, nor do the end users. The companies who distribute wholesale products are specialists in warehousing and shipping and are unlikely to know polyurethane from HDPE because they don’t need to. The engineers who design and specify properties for the manufacturer are the key decision makers in the value chain.
The plastic manufacturer produces a polymer to give a set of particular physical properties. The converter takes the polymer pellets and combines them with additives, if any, to meet particular specifications. Polymer properties depend to a large extent on their thermal history. Once melted and cooled a polymer’s physical properties can change. Heating and cooling can lead to new phase transitions not present in the pellets. One change could be the glass transition temperature where the rigidity of a polymer changes from glassy to rubbery. Imagine a plastic coffee cup with a glass transition temperature of 75 oC trying to hold 87 oC coffee. Such a cup sags when the coffee is poured in. This is no good. The phase changes like glass transition temperature or melting temperatures can be identified with Differential Scanning Calorimetry (DSC).
Synthetic polymers such as PE are everywhere in our lives. These polymers are made from crude oil or, especially in the US, natural gas feedstocks. Collectively we consume and throw away massive amounts of polymer waste. The effort to recycle plastic in the US has largely been a failure due in part to insufficient segregation and cleaning. Closing the loop with a strong demand for recycled plastics has also faltered. Apart from recycling, what else can be done with it?
Plastics as fuel
Sending a metric ton of polyethylene plastic to the landfill produced the same energy as sending a ton of gasoline or diesel to the landfill in terms of potential energy. Synthetic polymers are either entirely hydrocarbon in composition or mostly so with some oxygen, nitrogen or chlorine thrown in. The fundamental fact is that these polymers are high in BTU content. The downside is that they ignite poorly due to the lack of volatiles. The polymers have to be thermally “cracked” or depolymerized to form volatile components that have a lower flash point. This cracking requires higher ignition temperatures than liquid or gas fuels.
Specific energy density refers to the amount of chemical energy per kilogram of material. In the table below the top three listings are pure hydrocarbons. Coal contains hydrocarbons but also minerals that do not contribute to overall combustion energy.
In liquid combustion, it is the vapor above the liquid that burns. All liquids have a certain fraction of substance in gas phase at equilibrium above it at a given temperature. The flash point is the temperature in which the vapor can sustain combustion. Here is the official definition-
The flash point of a material is the “lowest liquid temperature at which, under certain standardized conditions, a liquid gives produces vapors in a quantity such as to be capable of forming an ignitable vapor/air mixture”. (EN 60079-10-1)
In normal use, flashpoint (Fp) is used to gauge the ease of ignition of a substance when exposed to air. The Fp allows us to partition high hazard from lower hazard combustible materials high flashpoint liquids like motor oil pose less of a fire risk than does gasoline or propane. In the Globally Harmonized System (GHS) of Classification and Labeling of Chemicals,-
Flammable liquids are categorized by flammability, from Category 1 with a flash point < 23 °C and initial boiling point < 35 °C to Category 4 with flash point > 60 °C and < 93 °C.
Naturally, in the US we do it a bit differently with categories Flammable and Combustible–
Flammable– Flash point < 100 oF (38 oC), e.g. gasoline, methanol, acetone, natural gas
Combustible– Flash point > 100 oF (38 oC), e.g., paper, organic dusts, cooking oils
The US system is easier to remember than is the GHS but is perhaps a bit imprecise.
Plastic combustion
Why all of this vapor pressure stuff? It turns out that most plastics like polyethylene or polyethylene terephthalate (PET) have insignificant vapor pressures at room temperature. This is due to the extremely long chain lengths of the polymer and its subsequent high molecular weight. Considerable energy is needed to loosen these polymers from the liquid phase into the gas phase. So, the trick is the use pyrolysis to crack the long chains into shorter and more volatile pieces. This can be called destructive distillation like the process used for making coal gas. But this requires an input of energy to raise the temperature high enough to do the cracking.
Plastic pyrolysis is conducted at temperatures between 300 oC and 1000 oC with residence times between 0.5 seconds to 100 minutes, depending on the temperature. YouTube has videos of people using homemade pyrolysis reactors to produce a diesel-like composition. The thermally cracked polymer produces vapors that are condensed and recovered. There are a few examples of homebrew crackers that vent the exhaust subsurface into water to condense the vapors. Seems clever until you realize that when the cracker begins to cool, the fluid in the condenser tank will siphon back into the still hot cracker and flash explosively into vapor. An inline trap could easily prevent this.
In 2007, EPA compared waste-to-energy emissions between 1990 and 2005; it found decreases of 24 percent in nitrogen oxide, 88 percent in sulfur dioxide, 99 percent in dioxins and 96 percent in mercury.
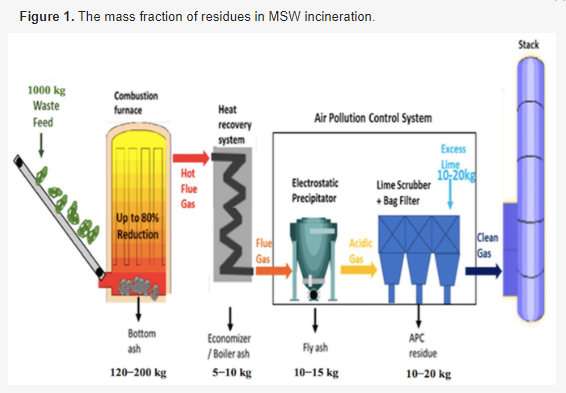
In addition to heat for steam production to drive electrical generators, pyrolysis of plastics will indeed produce CO2,hydrochloric acid (from PVC) as well as ash and char. Properly done, the ash, char and hydrochloric acid can be effectively scrubbed. Some thought will have to be given to the ultimate disposition of solid residues which will contain what remains of the mineral additives found in some plastics. Some may not be friendly.
It is hard for me to imagine the world completely shutting down petroleum-based energy resources. CO2 emissions do not need to be totally extinguished. A sustainable CO2 output has been put forward by James Hansen, et al., and at ColumbiaUniversity’sEarth Institute. They suggest that an initial target of CO2 levels below 350 ppm would likely be sustainable. The caveat is that continued research to refine a sustainable level.
By merely existing on Earth, humans will continue to produce air, water and soil pollution. We’ll continue to burn fossil fuels to some extent and continue to belch combustion gases into the air. I think this is a given. Humans will continue to collect raw materials for manufacturing. A mass movement to live a more modest, low consumption zero carbon footprint life is unlikely to occur. But, how about just a lower carbon footprint?
The point of this little pyrolysis excursion is that plastics are a potential energy resource that we wantonly toss into the landfill or in the street. Pyrolysis always produces solid waste residues which must be disposed of, so waste is still being produced, but a smaller volume than the plastic waste. As usual, the costs and benefits of the process depend on the balance of input costs vs output value.
As of March 2024, the CO2 level is a 425 ppm. We should remember that we do not have to drop the atmospheric CO2 to the level of the year 1800, just below some value like 350 ppm according to Columbia University. What we can do now is to begin living a somewhat lower consumption life. Instead of driving 5 miles to 7-Eleven in your F-150 to buy Miller Lite, cigarettes and lottery tickets, consider making all of your purchases next time you gas up. Consider backing off just a bit on plastic consumption.
Oh, and shut off the damned lights when you vacate a room. Unplug “wall-wart” device chargers that are not in use. They draw a trickle charge even when not in use. Have an “instant-on” TV or stereo not in use? Unplug it. The instant-on feature uses electricity to stay instantly ready for you. If it doesn’t “click” or it switches on/off by remote, it is likely an instant-on device. There. I’m finished now.
In a preliminary report by the Rhodium Group, the US GDP expanded by a projected 2.4 % as 2023 greenhouse gas emissions were down by 1.9 % across the economy, from 2022 levels. The report says that in 2023 the winter was relatively mild and emissions from coal fired power plants were down. That said, industrial emissions were up by 1 % and in the transportation sector, fuel consumption was below pre-pandemic levels while transportation emissions were up by 1.6 %. The uptick in transportation emissions is attributed mostly to a rebound of jet fuel consumption after the pandemic.
Driving the overall decrease in 2023 emissions was an 8 % decrease in the power sector and a 4 % drop in greenhouse gas emissions from commercial and residential buildings.
Ominously, natural gas power generation grew twice as fast in 2023 as did renewable generation. Oil and gas production is expected to rise in 2024.
Wind turbine installations are on track for one half to one third of the previous year, but utility-scale battery installations are projected to have a good year in 2023.
The bulk of industrial emissions was attributed to leaking, venting and flaring of methane and CO2 during production and transportation of oil and gas in 2023. Just an FYI: natural gas leaks can be fixed but in oil and gas production there are places in the process where pressure arising from volatiles like methane must be relieved for safety purposes.
This can be done with venting the pressure into the air or by flaring the gases. A big problem with venting flammable natural gas or other volatiles from equipment is the possibility of a fire or explosion. Flaring is a common way of avoiding this hazard. Flaring catches everyone’s attention as an obvious source of pollution and it is. What it should tell you is that problematic volatiles are being discharged and burned. At least it converts natural gas into CO2 which is the lesser of two evils as far as greenhouse potential.
Running vented natural gas into a gas pipeline poses many practical problems. For the many remote locations, where does the gas go? Refineries tend to cluster around seaports. Unusable natural gas is called “stranded gas.” Building an extensive network of gas pipelines from gas fields is not economically feasible in most cases. Liquifying natural gas to a smaller volume of liquid for over-the-road trucking is a great idea but there is an immediate and expensive problem. Liquifying natural gas to LNG requires refrigeration. Retrofitting existing upstream gas field equipment is a nonstarter due to cost.
Reducing fossil fuel consumption will do the trick. Less demand, less production, and less fugitive emissions of greenhouse gases. Sadly, our stone age emotions haven’t caught up with our modern technology. Liquid fossil fuels are energy dense and can easily be piped to where they are needed. This provides immediate gratification of our desires. Need cigarettes and beer? Hop in the F250 and drive 5 miles to the 7/11.
The year 2023 has been a bad year to be a canal user. Between a drought aggravated by El Nino and a shooting war by Houthi terrorists, transit costs and risks have risen steeply.
The two major canals for transoceanic shipping in the world are seeing events affecting their operation which are beyond their control. The Panama Canal is suffering a slowdown in transits due to a drought reducing the water level of Gatun Lake which feeds the canal lock system. The Suez Canal is being affected by hostile Iranian-backed Houthis in Yemen threatening shipping in and out of Israel moving through the Red Sea. They claim to be after ships to and from Israel, but it doesn’t appear that their target identification is very good.
The Suez Canal does not use locks so it can pass more ships per day. While the Panama Canal suffers from drought limiting its throughput, the Suez Canal has no new physical impediments. It is affected by ship operators who elect to bypass the Houthi threat by going around the Cape of Good Hope. Since 17 November, 2023, 55 ships have rerouted around the Cape of Good Hope and 2,128 ships have passed through the Suez Canal according to Reuters.
The Panama Canal auctions-off transit slots on a daily basis. During normal conditions before the drought, there were 36 transits per day. At the start of December, 2023, that rate was at 22 transits per day and the cost of a transit has risen accordingly. As of 15 December, 2023, the transit rate was increased to 24 transits per day through both the Panamax and Neopanamax locks.
The US produces more gasoline than it consumes and most of the excess is exported from the Gulf Coast. For buyers along the Atlantic basin, the US produces the cheapest gasoline. The Gulf Coast also supplies refinery products to the Pacific rim via the Panama Canal.
Within the US, gasoline prices have been low owing to excess inventories. Because of the Panama Canal slowdown, some refineries may have to reduce production to prevent further inventory buildup, potentially resulting in increased prices generally and heating oil in particular.
Panama Canal “slots are prioritized according to highest bid in auction processes, full containers, market and customer rankings,” according to Reuters.
The continuing drought in Panama has caused the Panama Canal Authority to restrict traffic to smaller and smaller vessels. The critical variable is the draft of the ship. The water in Gatun Lake which feeds the locks is getting shallower with the drought. Traffic is down to 60 % of capacity at present and is expected to drop to 45 % by early next year.
The most affected US traffic are those going between the Gulf of Mexico and Asia-Pacific ports. This has also intensified the bidding war for smaller tankers able to make the Panama Canal transit, increasing transportation rates and lengthening shipping times.
Some companies are opting to send their ships through the more expensive Suez Canal. This adds 10 days to a voyage in some cases.
This transportation bottleneck is also negatively affecting US liquified petroleum gas (LPG) and natural gas liquids (NGL). According to the US Energy Information Agency (USEIA), Asia accounts for 53.8 % of US gas liquids shipments abroad this year at 2.6 million barrels per day. Compounding the problem, vessels carrying gas liquids have lower priority than larger vessels paying larger tolls. Ships can bid to cut in line but the prices are steep, up to $2.5 million for an LNG tanker and $100k to $500k for medium sized tankers.
According to the International Energy Agency, IEA, the current wave of oil refining capacity growth is likely to be the last of it. IEA is forecasting that beyond 2030 global refining capacity growth will begin to recede. The latest World Outlook Report forecasts that global capacity will see 105.2 million b/d and by 2050 growth be tapering off to 105.8 million b/d. This is from 102.7 million b/d in 2022.
Remember, this is receding growth overall, not receding consumption overall. IEA expects North America to see reducing refinery capacity on the order of 1.4 % between 2022 and 2030. To meet emission reduction goals, North American capacity will have to reduce by 7.5 % from 2022 to 2030. By contrast, under current policies India is expected to see an increase in refining capacity from 7.2 to 7.5 milling b/d by 2050.
The Age of Petroleum is approaching a production plateau as the oxidation of hydrocarbons gives way to harnessing the reduction potential of metallic lithium. Oh, what a time we’ll have! Think of all of the new failure modes we’ll discover.
On top of all of the current challenges to fire departments, there is a new one. Source: Battery Fires.
The US Energy Information Agency, EIA, has just released a new energy conversion relationship for the British thermal unit (Btu) and the kilowatt-hour (kWh). It is 3412 Btu/kWh.
On September 26, 2023, we released our primary report on recent and historical energy statistics, the Monthly Energy Review(MER). Beginning with the September 2023 MER, we have updated the way we calculate primary energy consumption of electricity generation from noncombustible renewable energy sources (solar, wind, hydroelectric, and geothermal). We will now calculate consumption of noncombustible renewable energy for electricity generation using the captured energy approach, which applies a constant conversion factor of 3,412 British thermal units per kilowatthour (Btu/kWh), the heat content of electricity. This approach is a change from our current methodology, called the fossil fuel equivalency approach. The captured energy approach is more consistent with international energy statistics standards than the fossil fuel equivalency approach.
I post this kind of petroleum-related information with the hope that more people will pay attention to large-scale energy in general and oil & gas in particular. It is fashionable to pooh-pooh the petroleum sector for several reasons but, like it or not, it is one of the pillars of civilization. If we are going to be steering it in some particular direction, we should know a bit more about it.
There is a great deal of fascinating technology in oil & gas extraction and refining. The funny thing is that when you learn more about a subject, the more level your viewpoint on it will become, to the plus or minus side.
The International Energy Agency (IEA) is predicting that growth in annual demand for crude oil will shrink from 2.8 million barrels per day to 0.4 million barrels per day by 2028. This is interpreted to be the result of the global shift to cleaner energy alternatives as well as high prices and security of supply issues. By 2028 IEA says that peak oil demand may be in sight.
IEA also predicts that the use of oil for transport fuels will go into decline by 2026. Many more insights into the global oil market are to be found in the link.
Note that this report is about oil, not natural gas.
The Telegraph published an interesting opinion piece on unanticipated problems with increasing dependence on renewable energy sources in the UK. The author was Dr Capell Aris PhD, a former Fellow of the Institute of Engineering and Technology of the UK. The thrust of the article has to do with grid inertia. It turns out that rotating generators have energy stored in heavy rotating turbines that can compensate for short interruptions in the power grid. Wind and solar power generating stations do not have inertia like a steam or gas turbine does at a conventional power plant.
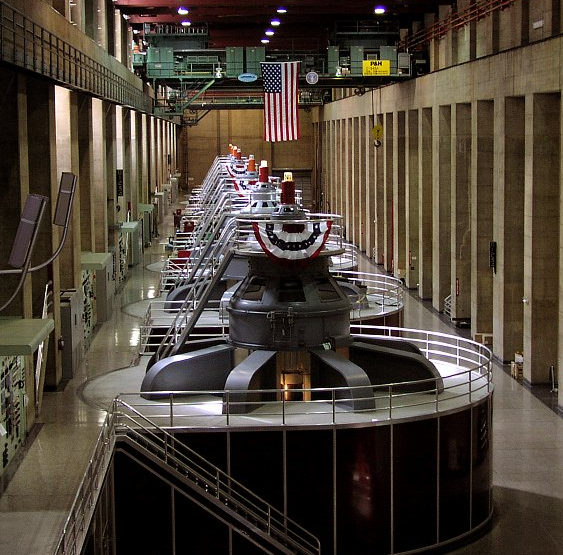
Power generators at Hoover Dam.
A critical parameter that power generating stations must watch is the line frequency. The entire US power grid must be producing 60 Hz power all of the time for stability. The load on a system must be in line with the supply. If the load exceeds what the grid inertia can supply, then overloaded generators will begin to slow with reducing line frequency and voltage. This forces the plant to disconnect neighborhoods on the power grid to bring the frequency and voltage back into line. This is called load shedding. If the plant generator frequency drops outside of specifications, the plant must disconnect. Allowing the generator frequency to stray too far from 60 Hz +/- 1 % can lead to physical damage of power transmission equipment.
Power sources that lack this inertia remove stability from the grid. Solar and wind cannot participate in this stabilizing feature. It’s just physics.
The power outage in Texas on Feb 21, 2021, relates to this in some ways. There is a very informative article by Houston Public Media here which I won’t repeat in detail. The upshot is, due to a winter storm a number of power plants in Texas went off-line, leaving too few plants remaining to service the load on the grid. Oh, yes, somehow Texas has constructed a power grid that is isolated from the rest of the US. It is managed by ERCOT, Electric Reliability Corporation of Texas. So, as power plants dropped out, there were fewer and fewer remaining stations providing inertia to the Texas grid. Plants remaining in operation faced higher loads than they could service and saw reducing line frequency, causing them to gradually blackout certain areas. Operators made a last call for blackouts when the line frequency dipped to 59.3 Hz. More blackouts did the trick. Only after widespread blackouts were they able to achieve a steady state and avoid a total collapse.
One shining example of a scarce resource in need of conservation is the Rare Earth Elements (REE) series generally, and Neodymium, Nd, and Dysprosium, Dy, in particular. Nd is described as hard and not very malleable or ductile and Dy is very malleable. Both have a silvery metallic luster and similar chemistries forming +3 cation as the most stable cation. The REEs are often divided in a funny way. There are the Lanthanides which can be further subdivided into two subgroups – the light REEs from Lanthanum to Europium and the heavy REEs from Gadolinium to Lutetium. Of the lanthanides, heavy REE deposits are more scarce, but of the heavy group Dy is the most abundant.
Promethium is highly radioactive Lanthanide with a half-life of 17.7 years for the longest lived isotope, 145Pm. Interestingly, the mode of decay for this isotope is electron capture, sometimes called K-capture. Promethium has only a transitory existence due to its short half-life. The entire group of REEs share the ability to form +3 cations. This increases the difficulty of isolating pure elements from an ore since most ores contain multiple REEs. Worse, the +3 Lanthanides also have similar ionic radii allowing for them to substitute with each other in minerals. Similar ionic radii makes it a bit harder to isolate them.
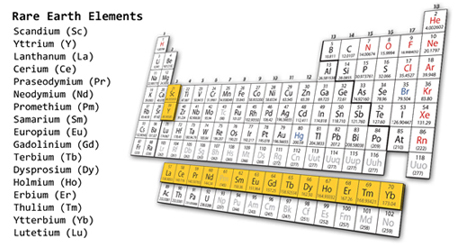
The other subgroup comprises Scandium and Yttrium- sometimes called the Scandium group. In the periodic table all of the REEs are transition metals in Group 3.
For clarity, the periodic table below shows a yellow vertical column of two elements, Scandium and Yttrium. They are members of the REE group. The yellow row of elements below are the Lanthanide elements. All together they make up the REEs. The Lanthanide elements differ from the other two REEs in that they have f-orbitals with valence electrons.
Chemistry is about what valence electrons do. These are the electrons that interact with the world around the atom or molecule. All electrons in an atom or molecule spend their time in special regions of space called orbitals. Electrons in the outer valence level can be taken away or shared. If there is an empty space in the valence level, electrons can be dropped in. Valence electrons form chemical bonds. These electrons are chemically reactive because they are furthest from the nucleus and feel the least nuclear attraction. But their reactivity mostly disappears if the valence orbitals are full. Inert gases are inert because their valence orbitals are full. It is possible for empty low-lying orbitals to accept electron pairs from other neutral species like H2O, phosphorus compounds, carbon monoxide and the like. Metals can have both negatively charged and neutral species docked in place around a metal cation.
Removing a valence electron from an atom is called oxidation and dropping an electron into the valence level is called reduction.
Electrons spend their time in specially shaped regions of space around atoms and molecules called orbitals. We do not need to know where an electron is exactly at any given moment. The orbital shapes define where electrons spend 95 % of their time. Orbitals do not have sharp edges. They taper off into space. The image below is a more realistic representation of where electrons can be found. Orbitals represent regions where there is the largest probability of finding electrons of a certain energy. If you consider a spherical space surrounding an atom, you could say that the probability of finding an electron within is p=1. But due to the peculiar shape of the spaces where electrons spend their time, an electron is more likely to be in the space defined by spherical harmonics. Therefore, any given space within the sphere could be assigned a probability per cubic picometer of containing an electron, depending on its location. Probability per unit of volume can be referred to as probability density. It is the probability density represented by orbitals that is wavelike in quantum mechanics.
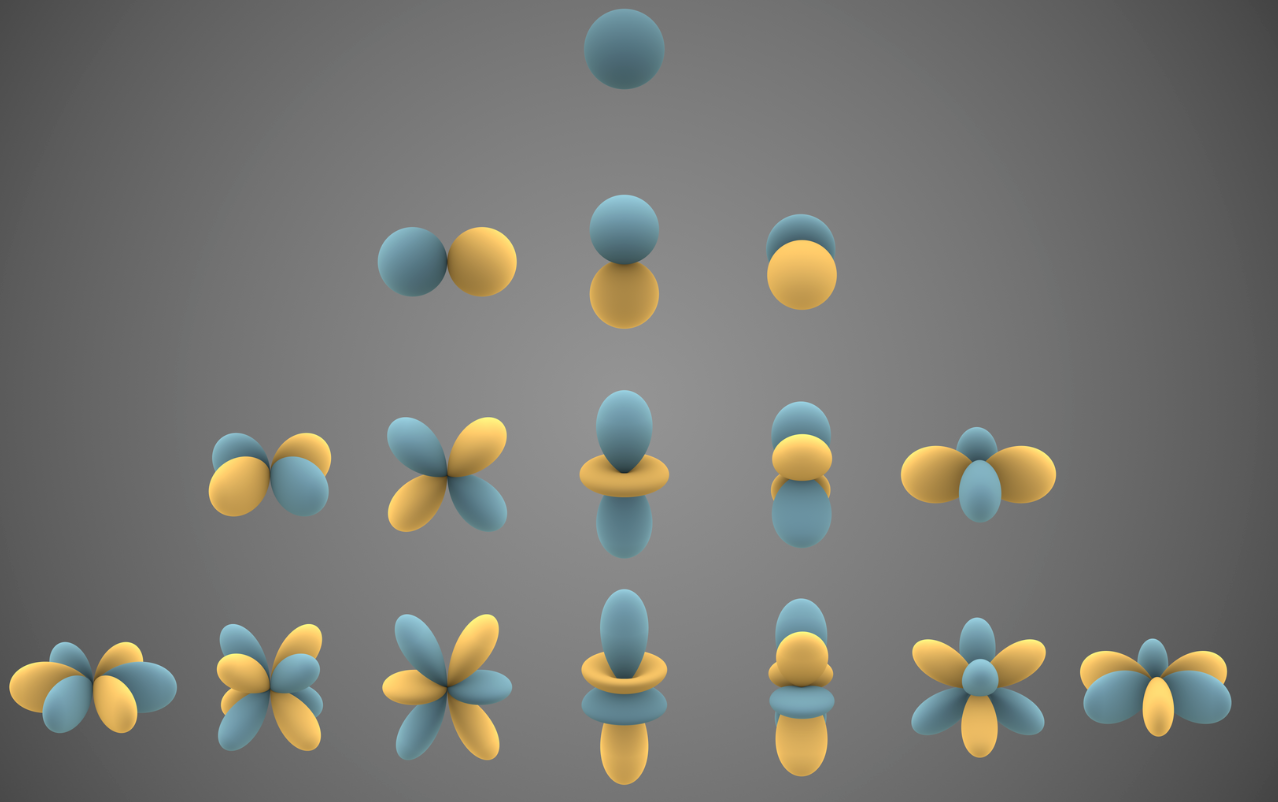
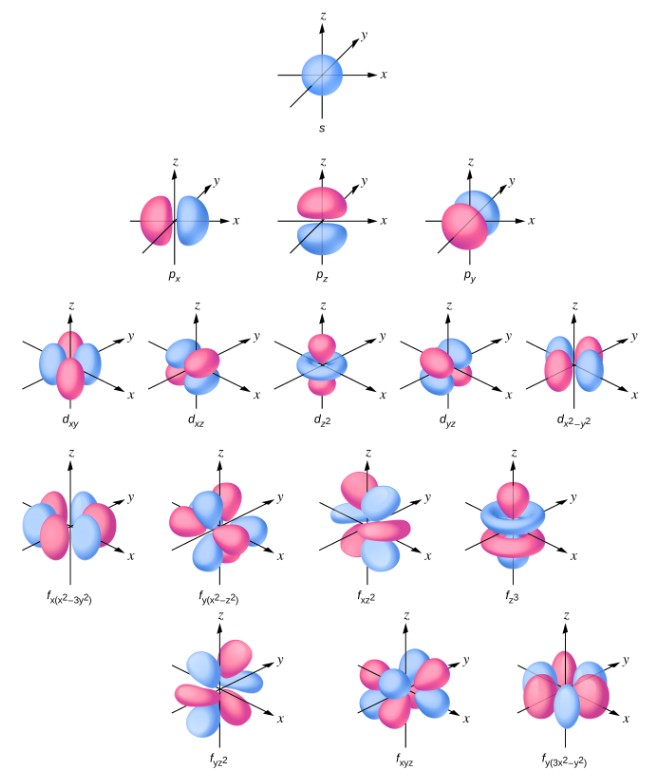
It turns out that we can describe the space electrons occupy if we apply the mathematics of a spherical harmonic series. The image below shows 4 levels of the series. The shapes define the space that electrons occupy around an atom. Each row represents a group of individual orbitals. Top to bottom, they are labeled s, p, d and f. The orbitals are filled with electrons theoretically in order from top to bottom rows as you move up the periodic table by atomic number, with each orbital holding as many as 2 electrons. Remember, orbitals are not physical objects. Each of them define a region of space in which one or two electrons spend their time. Also, there is some nuance in the energy levels of the orbitals. No matter though for this post.
Below is a chart showing atomic orbitals oriented in an xyz coordinate system. Interactions of orbitals between atoms or molecules very much depend on how they are oriented as they contact.
The common elements we are most familiar with have s, p and d valence orbitals around the nucleus. As we increase the atomic number of the elements we drop down the rows of orbitals on the periodic table, the valence electrons get further away from the nucleus where they are better shielded by the innermost electrons. The consequence is that the energy needed by the first valence electron to escape becomes smaller.
Neodymium magnetism comes from the 4 unpaired f-electrons with their individual spins aligned in the same direction giving the atom a large magnetic dipole moment. The unit crystal of Nd2Fe14B magnetizes along a preferred crystal axis that is difficult to change. So, the large magnetic dipole moment from the 4 unpaired electrons in each Nd atom in the unit crystal are locked in space.
We live in a time of permanent magnets with extraordinarily high magnetic field strengths. They’re called rare earth magnets and two REEs stand out in particular in this application- Neodymium (Nd) and Dysprosium (Dy). Nd is the primary REE in this type of magnet, but It turns out that up to 6 % of Nd can be replaced with Dy to increase coercivity and increase resistance to demagnetization. This is important for heavy duty magnet applications like windmills and electric cars. It is estimated that replacement of Nd with Dy in REE magnets amounts to ~100 grams of Dy per car. Based on Toyota’s planned output 3.5 million battery operated electric vehicles per year by 2030, the current reserves Dy would soon be exhausted.
Rare earth magnets are generally comprised of 3 elements; Neodymium, Nd; Iron, Fe; and Boron, B, proportioned according to the formula Nd2Fe14B. Dy is an optional component of these magnets.
So, obviously Dy is a highly desirable metal for efficient use of permanent RE magnets. Even among the REEs, Dy is a minor element. There are no known minerals having Dy as the major REE. The crustal abundance of Dy is 0.3 ppm and the recycle rate is <10%. The major reserve holders are China, Russia, and the USA. Incidentally, for some years now China has been disinclined to supply REE ore in favor of value added REE finished goods. This is in contrast to their buying copper ore from Chile or Peru in order to capture lower copper costs by doing their own refining. They know what they are doing.
Plainly, much is yet to be done in regard to putting a recycle loop in place for REEs in products. This is especially true for dysprosium. So, do we wait for the free market to respond when the situation is dire and the bulk of the REEs are already consigned to landfills around the world?
Note: For the sake of keeping the post light and airy, I’ve made some generalizations above. Of course there are exceptions and nuances. There always are.