Category Archives: Instrumentation

Navigating the Rocky Coastlines of the Chemical Business

[Note: Formerly named “PhD Chemists are freaks!!,” this essay has been renamed to better match the content.]

Preamble: Yes, yes, yes. Obviously, I’m aware that my experience in no way represents the careers of nearly all chemists. As usual, I drift into adjacent chemistry topics. Get your hands away from the keyboard and just read.

Bud (a pseudonym), a PhD chemist consultant and coworker, claimed that people with the exalted PhD degree were freaks of nature. Bud opined “Just look at us! Who goes to school for as long as we did and then ends up in a place like this?” I didn’t add at that moment that between a BA, PhD, 2-year postdoc and a stint in the professor trade, I was in academics for 16 years and walked away from it. Just then I couldn’t defend how smart it might have been to tread down this path only to end up in an old office trailer where we were sitting at that moment.

Bud used to argue that PhDs in general were freaks in society. Only a small fraction of undergrads will go on to grad school and fewer still complete a PhD program. The fraction is smaller yet in the general population.

In science you need a PhD in order to have even a hope of leading an R&D project, technical C-Suite corporate position, institute or professorship. The degree isn’t intended to resemble a trade, but rather to be a highly educated scholar and a subject matter expert with good communication skills and a sharp mind. If one is investigating for new phenomena, an intimate knowledge of known phenomena is needed to discriminate a finding. No awards for rediscovery.

Bud retired from a career at a big chemical corporation only to jump back into the hairball as a sales consultant for us in his retirement. I was a couple of years into what would be my major career “choice” and was managing the sales & marketing department then. Somehow, I had stumbled into the business side.

Our other sales consultant, the “Great Gondini”, retired from a photocopier company as a PhD chemist developing magnetic media, charge transfer agents and other xerographic-related materials. From his soapbox he advised us to-

It’s not that non-chemical-company chemists couldn’t rise up the career ladder, but being in a niche subspecialty at a company that produced photocopiers was not the way to grow your career in chemistry. Often such a chemist may be the only chemistry PhD on site and is likely to suffer from professional isolation. Experience with project execution on time and on budget is a great way to rise in a company. Engineers frequently rise to top level positions because they understand technology AND quantitative economics.

I knew 2 BS/BA level chemists and 1 PhD level chemist who obtained MBAs. Their careers leapt into higher gear with their move to the business side. In business it is important for at least someone to understand how finance works in addition to the technology. Even graduating with a business minor might be helpful but not as much as an MBA. I got an A in ECON 101 but only I cared. Education in basic accounting is very helpful on the business side.

As I see it, some realities of being in industrial chemistry R&D.

In my organic-synthesis-oriented research group in grad school, the big dream was to get an R&D job in pharma R&D. Cool medicinal chemistry and a chance to help to cure disease for the benefit of mankind. It is an honorable and, if I may be permitted to say so, prestigious career as a pharmaceutical scientist. At least in the world of chemistry.

Since then, more than a few in my grad school cohort had been laid off by the pharma companies or joined another. A few have been laid off 3 times from what they believed were secure slots. Pharma companies, like most others, aren’t run by chemists for the most part. Quarterly EBITDA is a major driver for the board of directors. The C-Suites are packed with corporate and patent lawyers, retired CEOs, MBAs, Md/PhDs, CPA finance people and perhaps a PhD chemist heading up the R&D operation as a Director or Vice-President.

After my academic career and my short rotation through the polymer world, I ended up for 6 years in chemical sales and marketing which was limited by my personal geographic requirement of living in the mountainous western US. As my opinion of the pharma business matured, I discovered that, as a raw material vendor, to be ever so careful with pharma customer promises and purchase orders. Not because they are liars, but because many felt free to cancel orders even after bulk raw materials arrived and after our R&D effort to meet specs. Their interest in us was based on using our low bid to leverage another supplier on price. This is common actually and I have done it myself. They waved future business in our faces knowing that, probably, they would never send receive an invoice. Still, not unheard of. But the hassle and our wasted R&D and opportunity costs were especially galling. But we were a spot supplier and susceptible to such disruption. My company didn’t like to sign contracts at that time, so we always took the risk on spot buys. Spot sales gave us manufacturing flexibility as a custom chemical producer, but at the expense of uncertainty. Later, attracted by the same sweet songs of Lorali that led hapless sailors into the rocks, we would repeat this fool’s errand once more.

Off-topic advice

Back to our regularly scheduled programming

On one occasion a big pharma customer wanted a product delivered across the Atlantic to Ireland. Time and distance weren’t the issue, though. It would equilibrate and precipitate below about 15 oC on the transatlantic voyage, so we bought heated shipping containers and installed them in Ireland on a site that wasn’t afraid of the W (indicating a water-reactive hazard) on the hazard labels or the safety data sheets. Scheduling heated transport could be sketchy in fall, winter and spring because most were booked for shipping fruits and vegetables. So, a month into the campaign and after an encouraging site visit by two of us sales guys (Tipperary isn’t so far after all), I received a call saying that they had changed their process (!?) and that a competing European supplier was chosen to ship directly from the continent on demand and without the (our) expense of staging heated storage. Once a pharma company writes in each raw material into their drug filing, changing suppliers or a change in specifications requires the heavens to open up and thunder “make it so.” In the end, they reimbursed us for raw material costs only. &#$@%*&^!! This would happen again later but with a more difficult product to produce.

My early career path led me away from the fabulous pharma world and into undergraduate teaching, initially. The other group members achieved their goals of a pharma R&D position. While I spent the next 6 years in academia one way or another, my grad school colleagues were drawing big salaries with 401(k)s in well-equipped labs, but in locations on the US East Coast, Gulf Coast or Midwest- regions that I would never consider moving to. In the end, most buoyantly bobbled up the career ladder to become directors and vice-presidents of R&D or technology as their final positions. No disrespect, just envy.

A few talented chemist colleagues from grad school climbed up the corporate ladder without business training, learning what they need on the job. Most others, though, remained in the tech end. The reality of being a scientist in industry is that upward mobility in a large corporation very much depends on your improvements in job performance, profitability, volume or especially the successful execution of a capital project. But capital projects are normally given to engineers because they are trained to deal with the cost of the equipment and in the cost of operation.

In my experience, a BA/BS, MA/MS or PhD chemist can usually retire as a senior bench chemist, analyst or lab project leader managing bench chemists. If you enjoy lab work, this is it. By retirement you’ve already topped out on the salary scale and have put away a fair sum in the 401 (k). It is a good life for a great many. But for myself, my interest in bench work dropped from hot to tepid after my 2-year postdoc. I got into molecular modeling and dynamics as a postdoc and actually answered a vexing question about kinetic vs thermodynamic control in a reaction that gave contradictory results. Even got a JACS paper out of it. It was fascinating stuff, but it made me look away from straight synthetic chemistry long enough to appreciate computational and physical chemistry.

As a postdoc I used AMBER and SPARTAN, I did molecular dynamics and molecular mechanics to make a stab what was possibly the global minimum strain energy. Ring strain calculations were used as a coarse screen for potential comonomers for the ring-opening polymerization (OP) reaction we were hoping to commercialize. The homopolymer was amber colored, brittle and rattled when handled as film. The comonomer idea based on the notion that the homopolymer contained too much crystallinity. The glass transition temperature needed to be at least below room temp. Suppressing the crystallinity and retaining certain key properties along with biodegradability was crucial. Even worse, the proposed comonomer must participate in reactive extrusion with the original monomer and be available in commercial quantities at a low cost. Finally, the copolymer needed to be water white. The color spec was difficult to achieve.

Final Comments:

My comments in this essay are based on personal experiences in my world. Your world is almost certainly quite different.

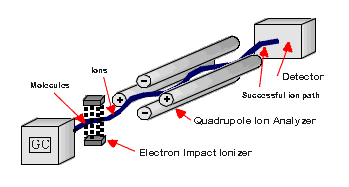
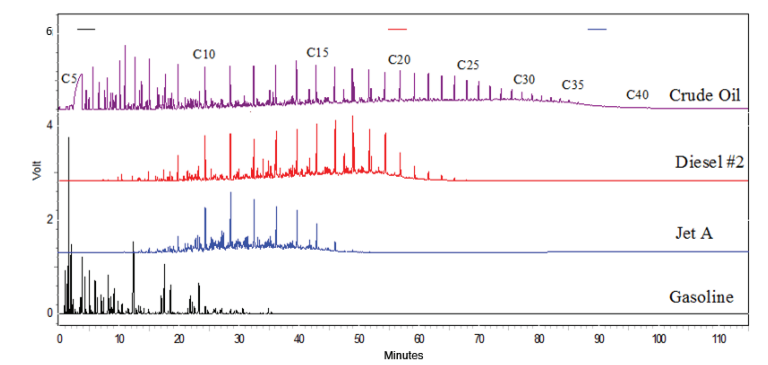
I haven’t mentioned analytical chemists because their world continues to be overtaken by automated instrumentation that will calculate the results and put together a report for you. Sampling and wet chemistry are still hands-on operations as far as I can tell. But this is taken as a challenge to instrument makers who will try to engineer around the hands-on requirement to provide something that can be automated. In my world I see more employee turnover with BA/BS analytical chemists than with organic R&D chemists.

As far as employee turnover goes, analysts are under continuous pressure to produce results so that production can proceed or to get product out the door. With hundreds of raw mats, intermediates, and final products, each with their own standard test methods and specs, I certainly wouldn’t last long as an analytical chemist.

Screw the GUI- Bring Back the Buttons and Knobs

During a recent trip to Texas, I rented a car as one does. It was a 2023 Jeep something-or-other. What kind of Jeep? A white one. It turns out that I own and drive a 1998 Jeep Cherokee. Obviously, there have been continuous upgrades over the years. One of the “improvements” is the graphic user interface, GUI, controlling the radio, ventilation and navigation. Maybe some other things- I couldn’t tell. Annoyingly, the thing searches for your phone as soon as the car powers up and complains when it can’t make a connection. It’s the goddamned internet of everything slithering up around my ankles insisting on my attention.

At the risk of sounding like a Luddite, I have to say that I find the trend towards automotive graphic user interfaces quite annoying. Certain features that were once controlled by knobs or buttons are now controlled on the GUI. If you want to adjust the air conditioning while driving, there is no longer a knob to grab without taking your eyes off the road. A knob can be turned on bumpy roads without looking at it. A GUI requires that you make a precise finger contact with a screen and not have it slide around.

Auto manufacturers have known forever that car customers are like baboons when it comes to buying cars. Any shiny new thing on the vehicle will draw their attention and increase the odds of a sale. The GUI in a new car will attract customers like flies to a dung heap, they thought. The appeal of automotive modernism is a sure thing for car makers. It’s true.

The appearance of the GUI in automobiles was no doubt preceded by a highly focused sales campaign by the electronics industry. I can just see it. Conference rooms packed with C-suite executives watching slick presentations touting the inevitability of the automotive GUI and the excitement of customers swarming dealerships waving cash at the sales team. What a wondrous future it is that lies before us. How can we cram every bell and whistle into these blessed touch screens? How can we print money even faster?

I am making a stand here and now to keep the control knob and the button, well known by the ancients to be reliable and simple. So it was and so it shall be.

The GUI is something that I will resist until I move from being on the top of the grass to 6 feet below the grass. Ok, I guess I am being a Luddite here but I don’t care.

The Refinery Crack Spread

Reuters has reported that the crack spread enjoyed by oil refiners is currently sitting around $37.50. The crack spread is the difference between the price of crude oil and the petroleum products coming from it. This number is an indicator of the profitability of refinery output.

Cracking is a major operation at oil refineries where heavy, long chain hydrocarbons are broken into shorter chain hydrocarbons. Crude oil naturally contains a limited amount of components suitable for modern engines. An important attribute is branching. The goal is to produce the most valuable products from otherwise longer chain, lower value hydrocarbons.

A Scratch in the Surface of Gas Chromatography

The analytical workhorse of the petroleum refinery is the gas chromatograph, or GC. The GC consists of a precisely controlled oven and within it is a coiled, small diameter hollow fiber many meters in length. It is called a capillary GC column. At one end of the column is an injection chamber with a silicone septum that samples are injected through via syringe. This chamber is hot enough to flash evaporate the sample but not so high that it decomposes. For instance, I have usually used a 250 oC injector temperature. A common volume of liquid to be injected is 1 microliter. The sample can be neat or a solution and must be scrupulously free of particles.

Inside the injector is the carrier gas input- helium is often used. A large amount of the vaporized sample is flushed out of the injector leaving only a small quantity of sample to be injected. Connected to the injector is the entrance of the capillary column. The goal is to inject a very narrow plug of sample into the capillary column all at once. After the injection, the detector is activated and the data collection begins. Progress can be followed in real time or not. Once the sample is on the column the GC run must be taken to completion. There is no reset for the column.

Capillary column. Source: Agilent.

The inside surface of the long capillary column can be just fused silica or it can have a coating. In any case, the components of the sample each have a different affinity for the inner wall of the capillary. As the carrier gas pushes the vaporized sample components along, the components with the least affinity for the inner column surface advance through the column fastest and arrive at the detector earlier. Generally, the higher the molecular weight, the lower the volatility and the longer it takes to exit the column.

At the terminus of the capillary column is the detector. There are a variety of methods used to detect sample and send a signal to the plotter or computer. A particularly useful type of GC system uses a mass spectrometer as a detector. The flow of components enters an ionization chamber and positive ions are generated by electron impact and sent through the mass analyzer and on to the detector. This is occurring continuously as the sample components exit the column. As the components are detected, a regular chromatogram is collected and displayed. The difference with the mass spec detector is that along the timeline, mass spectra are also collected. It is possible to select any given peak in the chromatogram and display the mass spectrum.

A mass spectrum for every peak. Source: God I hope they don’t mind my using this graphic. American Chemical Society. I don’t need ACS goons banging on my door again!
Graphic from NASA showing schematic of the GC Mass Spec aboard the Huygens probe to Titan.

A mass spectrum detector offers the possibility of identifying the individual peaks from the molecular ion mass and the fragmentation pattern. That said, not all mass spectra are easily interpreted. Only cation fragments are visible. Neutral fragments must be inferred.

A stack of gas chromatograms showing the components of crude oil and several derived products below it. Each peak indicates a single component with the intensity along the y-axis and time in minutes along the x-axis. The area under each peak is proportional to the % composition in the sample. On the left side of the chromatogram are the components that are more volatile and exit the GC column earliest. The right side shows the components that exited the column after longer intervals. They are the longer chain molecules. Source: IRTC.

Back to the Crack

The most valuable refinery products are gasoline, fuel oil (including diesel), and aviation fuel. Within these three areas are subcategories that split into different product lines. These fuel product categories are defined by the number of carbon atoms in the blend of hydrocarbon molecules, saturation, and branching.

Refineries produce blended fuels affording certain properties according to their use. These properties include boiling point and vapor pressure specifications, octane or cetane numbers, viscosity, and pour point specifications. Between distillation, cracking, aromatization and reforming a wide variety of hydrocarbon substances are available from refining for formulation. A refinery is engineered to produce the largest volume of the most valuable hydrocarbons from continuous flow processes at the greatest profit.

Oh, I was just joking about the ACS goons. They don’t bang on your door.

Life With an RC1

I’ve been using a Mettler-Toledo (MT) RC1e reaction calorimeter for about 6 years. Our system came with MT’s iControl software, RTCal, and 2 feed pumps with balances. Overall it has proven its worth for chemical process safety and has helped us understand and adjust the thermal profile of diverse reactions. Like everything else, MT’s RC1e has many strengths and a few weaknesses.

The RC1e’s mechanical side seems reasonably robust. Our instrument sits in a walk-in fume hood resting on a low lab benchtop supported by an excess of cinder blocks- it is a heavy beast. During installation we discovered that the unit would not achieve stable calibration with the hood sash closed. The control box mounted on the instrument didn’t work properly on installation. After a trip to the repair shop, the box was returned as functional but without finding the fault.

Recently we had a mixing valve fail in the heat transfer plumbing, resulting in down time. Diagnosis of this was unsuccessful over the email and phone, necessitating a service call. Parts may not be inventoried in the US and consequently must come from Switzerland. Expect Swiss prices and less than snappy delivery. Hey, it’s been my experience.

Addendum, 5/4/22:  After a nearly 1 year period of down time the RC1 was reinstalled at another location. Due to temperature regulation problems after the move, a technician from MT visited and repaired the instrument. It turns out that swapping one of the hot legs on the  208 3 phase feed for another can cause the stir motor to reverse direction. A relief valve related to the heat transfer system had failed in the partially open condition. It was fixed and the instrument now performs as expected.

Addendum 2, 6/10/22: The RC1 has failed again. The “fix” didn’t work. Same problem as before. Maybe in the next repair they’ll replace the bloody valve rather than just “unstick” it. Unrelated gripe- Getting parts from Mettler-Toledo in Switzerland has been frustrating. They have always been very slow. So much for Swiss efficiency.

A chiller unit is required for RC1 operation and can add 15-30 k$ to the setup cost. Users will have to contend with the loss of floor/hood space in the lab for the chiller and RC1. The chiller must be powerful enough to contend with the exotherms that may be generated in the instrument. Chillers can take many hours to get down to the set temperature. Given that RC1 experiments can also be lengthy, plan accordingly. Our (brand new Neslab 80) chiller requires nearly 2 and 1/2 hours to get from +20 C to -20 C, which is the lower chiller temperature we use, depending on the reaction chemistry. For reactions that are on the sporty side, we’ll drop the chiller to – 50 C.  This is near the  minimum temperature for the water-based chilling fluid we use. Early on I opted for an aqueous potassium formate solution with a very low freezing point. The instrument comes with a panic button that switches to full cooling in an emergency.

The chiller required the wiring-in of a dedicated single-phase 208 VAC circuit. With the chiller using single-phase and the RC1e using 3-phase 208 VAC, it is important to assure that one cannot inadvertently connect into the wrong power circuit (idiot proofing). The chiller plug design should already prevent this. It is critical that the electrician is alert to this and does NOT jury-rig the plugs to use the same style of connectors because he has only one style in the parts bin.

Some comments on the collection and interpretation of RC1 thermograms.

  • It is critical that those who request RC1 experiments understand the limitations of the instrument. For instance, we use a 2 Liter reaction vessel with a 400 mL minimum fill volume. Refluxing is not allowed owing to the huge thermal noise input from the reflux return stream. Special equipment is said to be available for reflux.
  • Experiments must be carefully designed to elicit results that can answer questions about feed rates and energy accumulation.
  • Like many instruments, the RC1 needs a dedicated keeper and contact person for inside and outside communication. A maintenance logbook should be kept next to the instrument if for no other reason than to pass along learnings from previous issues.
  • If thermokinetic measurement is part of your organization’s development SOP, someone on staff should be reasonably familiar with some chemical thermodynamics. That can be a chemical engineer, as may often be the case.
  • The users of thermal data are likely to need help with interpretation of the results. Be prepared to offer advice on interpreting the data, taking care not to over-interpret. If you don’t know, say so. It is easier to claw back “I don’t know” than “yeah, go ahead and do that …”.
  • Do not be anxious to singlehandedly bear the weight of responsibility for safety. Safety is a group responsibility.
  • Be curious. How do the insights and learnings from the data translate into best practices? What changes, if any, can the process chemists make to nudge the process for better safety and yields? A credible specialist in RC can make comments or ask questions that lead to better discussions on thermal hazards. Be a fly in the ointment.
  • Never forget that a reaction calorimeter is a blunt instrument for the understanding of a reaction. An RC1 thermogram is a composite of overlapping solution-phase phenomena. Interpretation of results can be greatly refined by pulling timely aliquots for NMR, GC/MS, or HPLC analysis.
  • A database should be constructed to collect and immortalize learnings from all safety work and RC1 learnings fall into that group.

There is the question of who collects and presents the data. An engineer or a chemist? Engineering thermodynamics is a big part of a chemical engineer’s education and skill set. As a plus, an engineer can take thermal data and apply it to scale-up design for safety and sizing of equipment and utilities. You know, the engineering part. On the down side, there may not be many chemical engineers who are comfortable with doing reaction chemistry.

Do not be anxious to singlehandedly bear the weight of responsibility for safety. Alpha males- are you listening??  Safety is a group responsibility that should originate from a healthy group dynamic.

There’s a good argument for a chemist to conduct RC experiments as well. A trained synthesis chemist is qualified to conduct chemical reactions within their organization. That includes sourcing raw materials, handling them, running the reaction, and safely cleaning up the equipment afterwards. But interpreting RC1 data has a physical chemistry component. In my experience, run of the mill inorganic/organic synthesis people may have seen PChem as an obstacle rather than a focus in their college education. Their skill set is in instrumental analysis like NMR and chromatography, mechanisms, and reaction chemistry. I would recommend having a PhD chemist in a leadership role when calorimetry is a key part of a busy process safety environment.

Safety data can be collected and archived all day long. The crucial and often tricky part is how to develop best practices from the data. I would offer that this is inherently a cross-disciplinary problem. Calorimetric data from reaction chemistry can be collected readily, especially with the diverse and excellent instrumentation available today. Adiabatic temperature rise, ΔTad, is a key measurement. A lab group may be interested in the maximum (adiabatic) heat rise for a given reaction. A smooth and efficient technology transfer from lab to plant happens when good communication skills are used. Yes, SOP’s must be in place for consistency and safety. But the positive effect of individuals who have good social skills and are prone to volunteering information cannot be underestimated.

Review of the FLIR ONE for Android

A FLIR ONE ® infrared imaging attachment for my Android 6S cell phone arrived at my door the other day. The price was initially a bit high, $350, but had recently dropped to a more attractive price of $249, so I pulled the trigger. The online transaction on the FLIR website was seamless and the delivery time was less than one week. At the time the FLIR ONE® was offered on Amazon for the same price.

The unit has two imaging sensors arranged horizontally side-by-side and one centimeter apart: One optical sensor and one Lepton IR thermal imager detecting in the 8-14 micron wavelength range. According to Optics.org, the Lepton is an “uncooled long-wave infrared (LWIR) microbolometer focal plane array”. The FLIR has its own battery which must be charged separately. It will not energize from your phone’s battery.

FLIR image of our front entrance, April 1, 2016.

FLIR image of our front entrance, April 1, 2016.

The unit arrives nearly ready for plug and play. Before it can be operated the user must download an app from FLIR. This process went smoothly and in a short time I had the unit operating. The compact FLIR unit connects to the Android via the micro USB connector on the phone.

About the imaging. The FLIR ONE superimposes the IR image atop an optical image that consists primarily of edge lines defined through high contrast. This is a useful feature because it improves the image sharpness and helps set the context of the IR image. In a darkened space the optical image is lost and only the IR image will be visible (second image).  The IR image itself is relatively low resolution owing to the limited number of pixels from the IR detector. At close range a significant parallax effect occurs, appearing as shifted overlap of the optical and IR images.

The image above is an example of a false color image captured from the FLIR ONE. The shot of this north-facing door was taken during late afternoon on a sunny day in Colorado. The internal air temperature was ~68 °F and the outside air temp was ~35 °F in the shade. As is customary, the coolest temperatures are indicated in blue and warmer temperatures are indicated by a gradient from red to yellow to white. The IR sensor seems to saturate fairly easily, but the automatic exposure control will get a handle on the image, though not instantaneously. I have found that the best images are had by limiting the frame to avoid including overly IR-bright features. This allows the exposure control to bring out thermal subtleties in the image much as any auto exposure feature would in the optical range.

FLIR ONE image of a gas hot water heater under ordinary operating conditions

FLIR ONE image of a gas hot water heater under ordinary operating conditions

The second image shows a basement gas hot water heater and the hot water output line directed upwards to the floor joists. The hot water lines are insulated with closed cell polymer foam insulation from the local hardware store. The water heater has nothing more than the factory equipped insulation.

The FLIR ONE indicates infrared temperatures by way of false color images and spot temperature readings. But temperature readings from IR thermometry are not the whole story when it comes to understanding fugitive heat losses, radiative or otherwise.

An IR image shows surface temperatures based on assumptions on average emissivity and scaling through the Stefan-Boltzmann law. The amount of radiant energy emitted by a black body is defined by the Stefan-Boltzmann law. A plot is shown here. Emissivity is the quotient of emitted energy from a surface divided by that emitted by a black body radiator at the same temperature. Every surface has a characteristic emissivity based on its composition.  According to the linked emissivity table, polished aluminum has an emissivity of 0.095; concrete 0.95; mercury, 0.12; sanded spruce, 0.82; and white lacquer, 0.95. All these values are at 100 °C.

Home water heater. Aluminum foil on vertical hot water feed line

Home water heater. Aluminum foil on vertical hot water feed line

In the third photo, a 1 ft x 1 ft piece of aluminum foil was wrapped around a stretch of the insulated hot water feed line above the heater, as shown in the photo. The foil is in thermal contact with the foam insulation on the 3/4″ copper pipe. Hot water was run for a few minutes to draw heated water into the plumbing. Caution should be taken in that IR radiation does reflect off of surfaces which may lead to inaccurate conclusions about heat flow in the system in question. Above, the aluminum foil is reflecting some IR from another source. Up close and from another angle the foil appears much cooler than it is.

Plainly the emissivity of the highly heat conductive aluminum is different from the foam insulated pipe. The foil is in thermal contact with the foam and should be near the temperature of the foam surface, but the false color image suggests that the foil temperature is lower in temperature. Because of its much lower emissivity (ca. 10 % of foam) the foil only appears to be cooler. The foil is less radiant than the foam which has an emissivity of ~0.90.

Polished aluminum has high thermal conductivity but low IR emissivity. Foam, which has high IR emissivity (see images), is known for it’s insulating properties. And by that we mean, foam is a poor conductor of heat. What aluminum lacks in emissivity, it more than makes up for in conductivity. And while foam lacks in conductivity, it appears to be an efficient emitter of IR.

It is useful to mention the meaning of “insulation“. A material that conducts thermal power poorly can be said to have insulating properties. Thermal power (dq/dt) is the flow rate of thermal energy (q) per second. Thermal power is the rate of flow in Joules per second. For reference, one Joule per second is one Watt. The valuable attribute of a thermal insulator is that it can resist the quantity of power (Watts) flowing through a unit area such as a square meter. The amount of thermal power moving across a unit area, like a surface, is called heat flux and is in units of W/m^2.  It is common to express thermal resistance through a material by the R-value. An R-value is the ratio of the temperature drop (ΔT) across the insulating material to the heat flux through it, Q:  R = ΔT/Q.  So, as the heat flux gets smaller for a given ΔT, R grows larger in magnitude. In practical terms, a large R-value is desirable for insulation.

Looking at the radiant stretch of emissive insulated pipe rising from the water heater, we might initially guess that the IR image shows the whole thermal picture. But really, this guess is muddied by details. A warm pipe will be radiating energy as well as losing heat by conduction to whatever it is in contact with and by air convection.

IR radiation thermometry is useful when measuring a surface temperature is not practical. Accuracy, however, will depend on the emissivity of the surfaces of interest. The FLIR ONE is an economical imaging device for capturing IR images of large areas. The spot temperature feature is useful for recording the temperature of desired objects. Image files are easily downloaded from the phone and manipulated as jpeg files. Users will find many good applications for this affordable and easy to use IR imaging system.

Easy and cheap is great, but it is advisable for those wanting to do commercial work with IR thermography to take credible coursework and obtain some credentials. There are a few subtleties to thermography and it is best to be a little overqualified than not. Thermography courses can be found on the internet.


Chemical Process Development

Lots of semi-batch process development and safety work going on in my lab. We use our reaction calorimeter for a variety of studies now. Naturally we want to know about energy accumulation with a given feed rate or any unforeseen induction or initiation problems in a reaction. We can also home in on recommendations for safe feed rates of reactants into a reaction mass.

What I am beginning to learn from the RC1 work is that running a reaction at low temperature is frequently done for sketchy reasons. Unless there are selectivity or side product issues, you really have to question why the reaction is specified to be run at low temperature. I think some of it comes from habit gained in grad school.  Low temperature may introduce dangerous situations with abrupt initiation by accumulation of unreacted reagents. Or it may lead to overly long feed time with the associated costs of added plant time and labor.

There are reagent incompatibilities like nBuLi in THF above – 15 C or so. But you’ll find that MeTHF is a bit more tolerant of temperature than is THF.

The precise temperature management capabilities (Tr) of an RC1 including the ability to lock on a temperature or precision ramping gives insight on solubility questions or on freezing points. The instrument also provides heat capacity data for engineering calculations. it is a very useful apparatus.

Plasma

Today I found myself peering at the lovely lavender glow of opaque argon plasma through the viewing screen of a gleaming new instrument. The light-emitting 8000 K plasma sits apparently still alongside the conical metal skimmer. Somewhere a Dewar was quietly releasing a stream of argon into a steel tube that was bent in crisp military angles into and through walls and across the busy spaces above the suspended ceiling. Another cylinder quietly blows a faint draught of helium into the collision cell. A chiller courses cooled water through the zones heated by the quiet but savage plasma. Inside a turbo pump labors to rush the sparse gases out of the mass analyzer and into the inlet of the rough pump and up the exhaust stack.

Up on the roof, the heavy and invisible argon spills along the cobbles of roofing stones until it rolls off the roof onto the ground where the rabbits scamper and prairie dogs yap. The helium atoms begin their random walk into space. The argon shuffles anonymously into the breeze and becomes part of the weather.

All of the delicate arrangements; all of the contrivances and computer controls in place to tune and play this 21st century marvel. And a wonderment it is. The ICPMS obliterates solutes into a plasma state and then taps a miniscule stream of the heavy incandescent argon breath that trickles into the vacuous electronic salsa dance hall of the quadrapole.  All the heat and rhythm for the sake of screening and counting atomic ions. What a exotic artifact of anthropology it is. And it all began in a rift zone in Africa millions of years ago.

New NMR on the Market: Non-Superconducting FT System.

Check out the picoSpin website. This company is coming out with a 45 MHz permanent magnet NMR in 1Q2011 that produces FID’s so the user may collect FT spectra.  The instrument is somewhat larger than a toaster and is sensitive enough for many undergraduate and industrial applications. The customer must provide the computer and data workup software.

The other company out there offering non-superconducting FT systems is Anasazi Instruments. They have been refurbishing the fleet of 60 & 90 MHz CW systems sitting in storage rooms throughout academia into FT instruments.

I am jazzed. I think we might get one. OK. It is low field and low sensitivity. But that is often enough.  For an in-process check very often you’re just looking for one or two diagnostic peaks to collapse or grow to indicate reaction progress. This instrument could fit the bill.

I think many people will agree that the big supercon systems on the market, while well endowed with capability, often provide wildly more capacity than is actually used. A sort of creeping featurism.  This instrument is utterly utilitarian in conception and priced at $20,000.

I think this is a welcome addition to the selection of NMR instruments for the chemical field and I wish them well in their endeavors.