We have a Cecil CE 2041 UV/Vis spectrometer. Data is collected by the DataStream CE2000 software package. The instrument has 4 nm of resolution, not the best, but still quite usable. To quote the famous British philosopher- “You can’t always get what you want!” (M. Jagger).
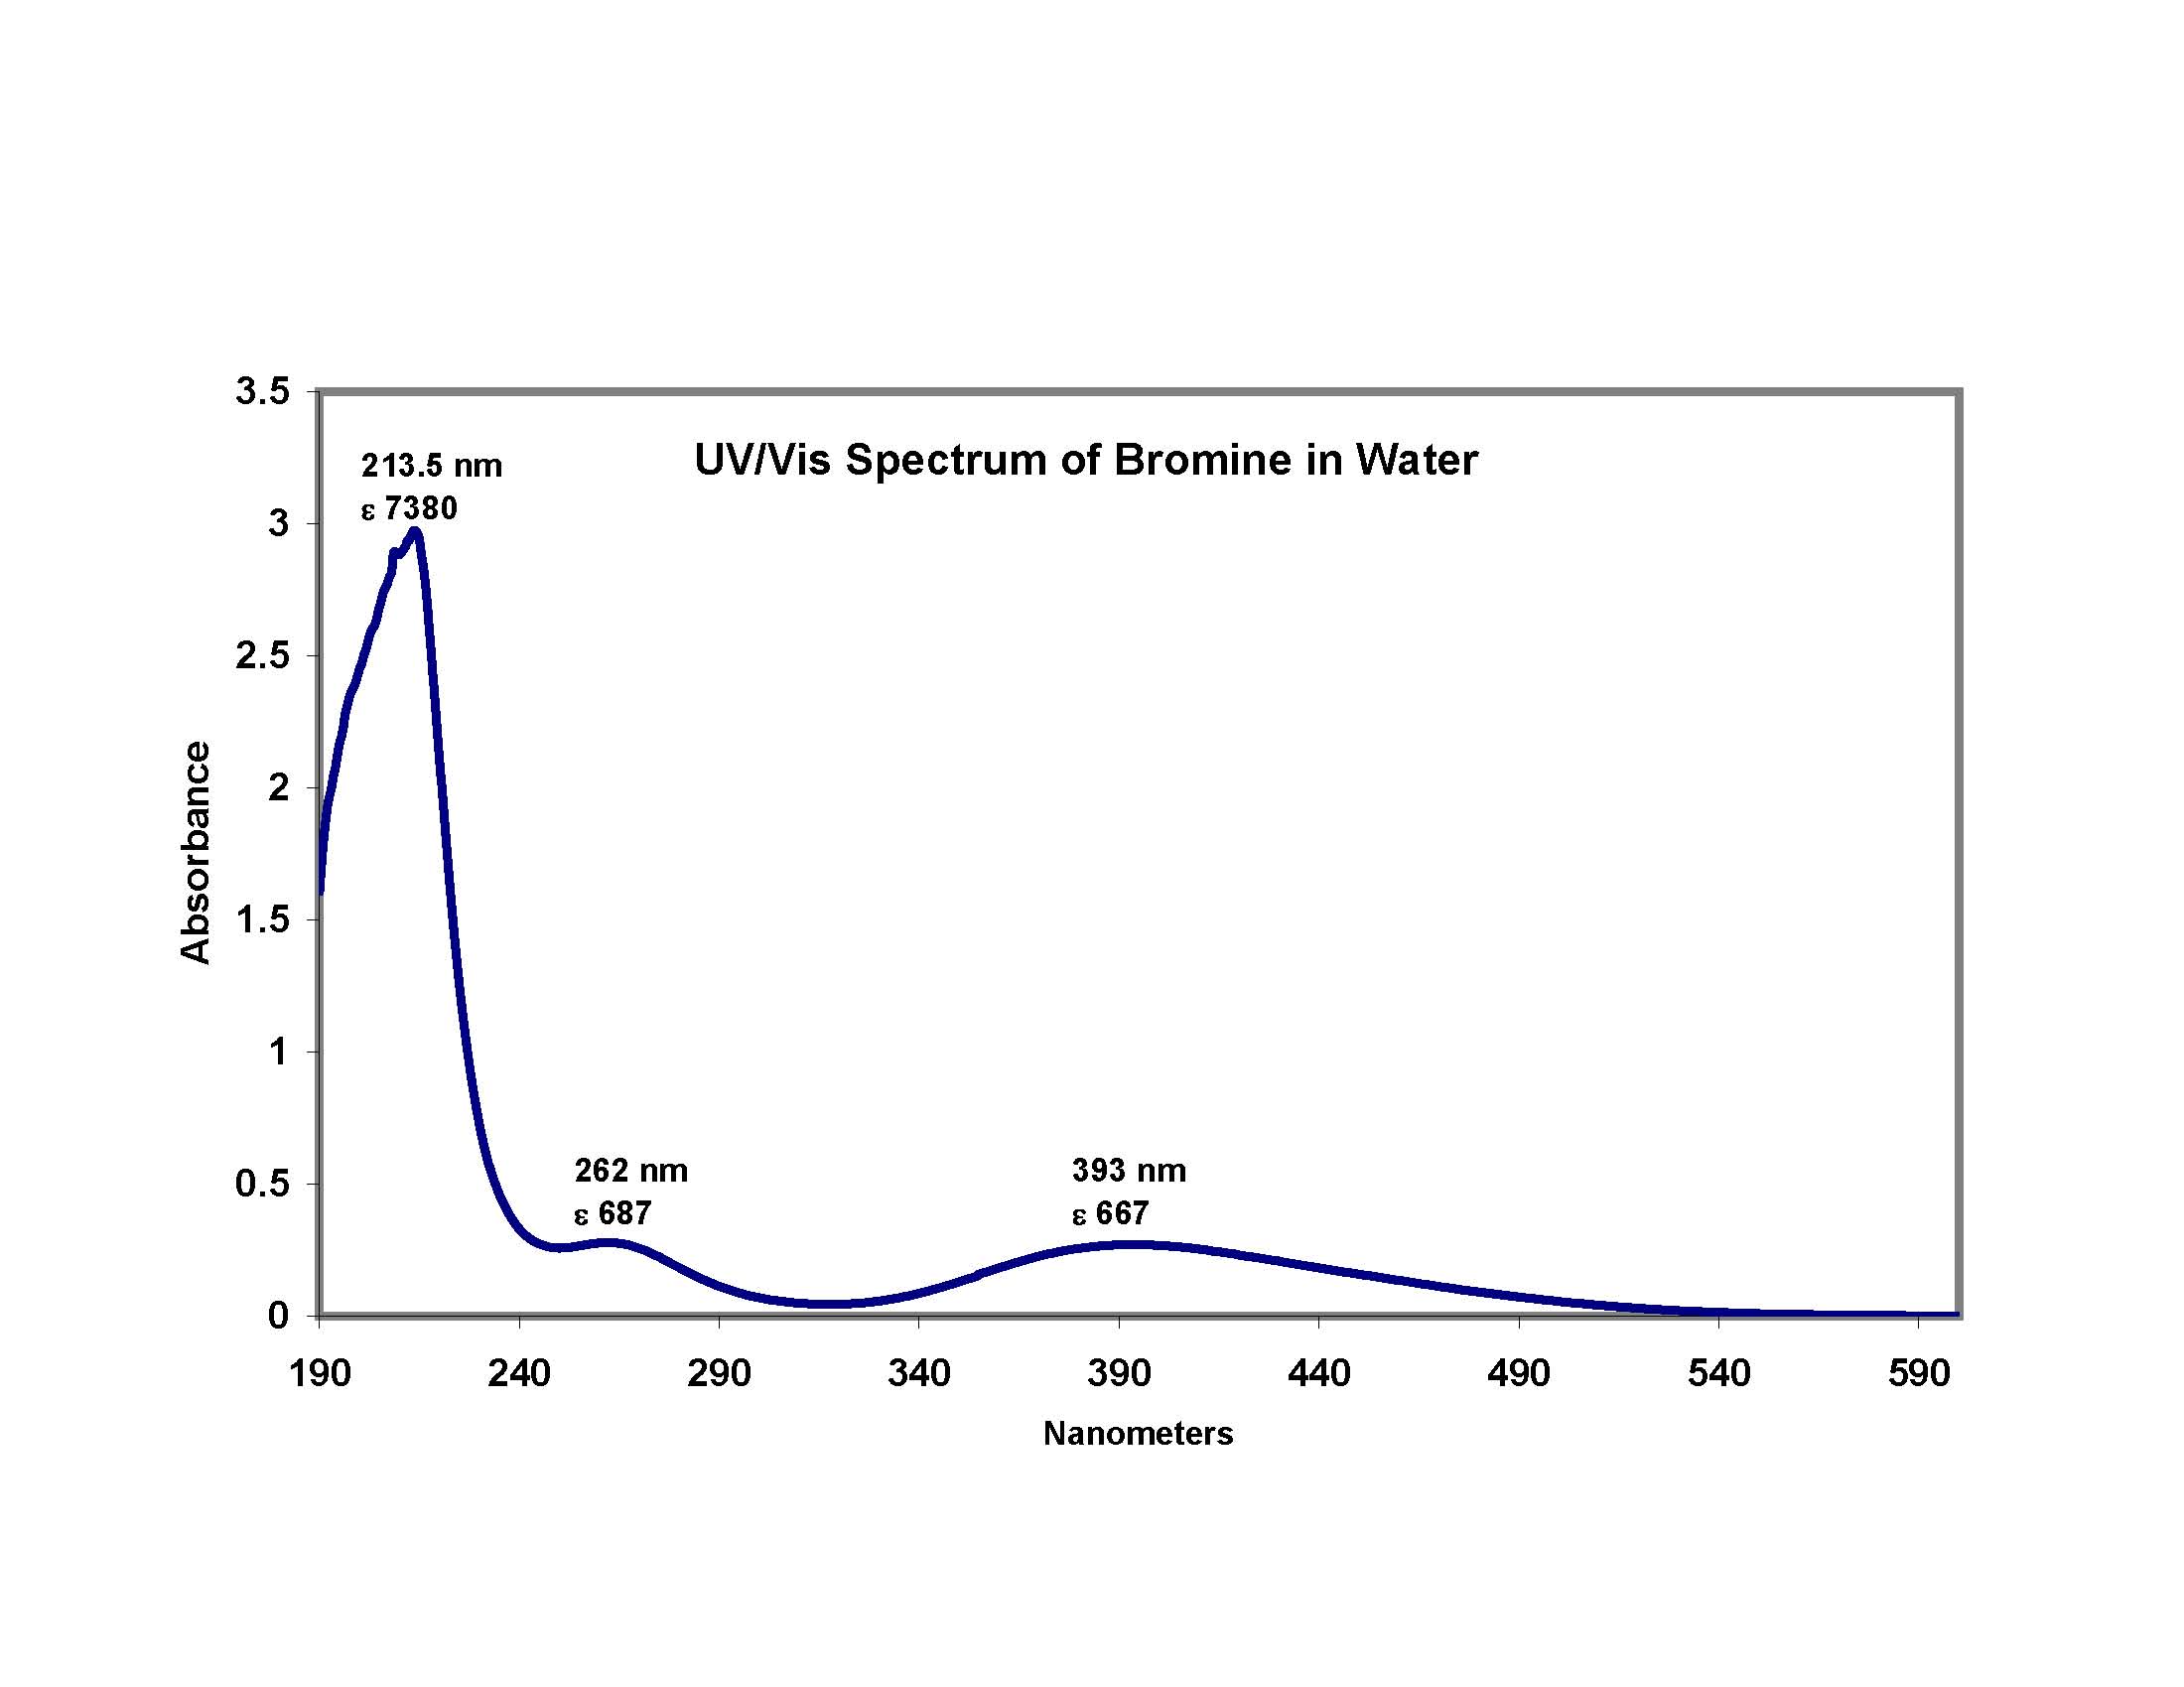
This posting is an experiment on how to upload data to the web. The graphic below is a jpeg conversion of a pdf conversion of an Excel chart. Seems like an awkward way to do this. Undoubtedly someone out there can offer a suggestion of how to upload an Excel graphic to the blogosphere.
It looks like prior to an upload the graphic has to be beefed up a bit. I’m gonna have to monkey with it some more. Maybe someone has a suggestion.

Try this:
Print you chart to a TIFF using the MS document image priter object. Then, get XNview (a good, free converter, xnview.com) and make a PNG image of the right size. PNGs, I find, look 1000 times better than jpgs, especially when “shrunk” for thumbnail purposes.
Milo,
Thanks. I’ll give it a try. I appreciate your comments.
Hi gaussling,
Please, can you send me your spectra of bromine in water on blueskyy555@yahoo.com
recently I have started UV measurements of trihalomethanes in water and I want to have all possible spectra playing as a interference. 10x a lot
Hi Steve,
I’ll send you an excel spreadsheet of the data and you can graph it anyway you please.
Th’ Gaussling
Pingback: Chemistry Help
The use an insulation layer consisting of a vacuum gap to suppress conduction and convection, as well as silvering to reflect stray infra-red.